


META Platforms Inc. (NASDAQ:META) Analysis: Blending Technical Strength and Fundamental Growth
A systematic method for stock selection mixes technical strength with fundamental growth traits, forming a solid methodology for finding possible market leaders. This approach uses Mark Minervini’s Trend Template to make sure stocks show strong technical health while adding high growth momentum standards to check underlying business strength. The mix tries to find companies displaying both price momentum and improving business fundamentals, possibly setting them up for continued strong performance.
Technical Strength Using Minervini’s Trend Template
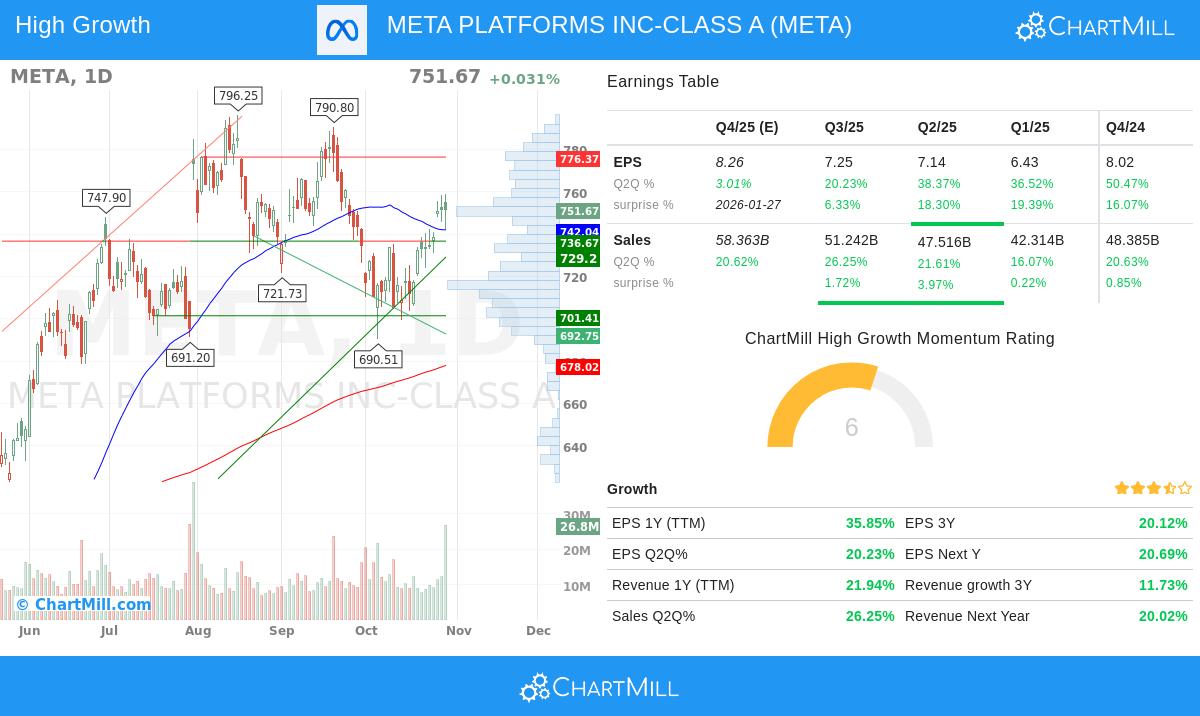
META PLATFORMS INC-CLASS A (NASDAQ:META) displays notable technical traits that match Minervini’s strict criteria. The stock currently trades at $751.67, situated well above all important moving averages, which is basic to the Trend Template method that looks for stocks in clear uptrends.
Key technical measures backing this view include:
- Current price trading above the 50-day SMA ($742.04), 150-day SMA ($686.25), and 200-day SMA ($678.02)
- All moving averages moving upward, confirming continued momentum
- Price situated 78% above its 52-week low of $479.80
- Trading within 6% of its 52-week high of $796.25
- Relative strength ranking of 74.45, showing better performance compared to the wider market
These technical traits meet Minervini’s main rule of concentrating only on stocks in Stage 2 uptrends, steering clear of the unpredictability of basing patterns or downtrends. The template’s focus on stocks trading near 52-week highs with good relative strength helps pinpoint market leaders instead of laggards.
Fundamental Growth Factors
Besides technical strength, META shows the fundamental improvement that Minervini points to as important for “superperformance” stocks. The company’s financial measures reveal considerable growth momentum in several areas.
Earnings growth has been especially strong:
- EPS growth of 35.85% over the trailing twelve months
- Quarterly EPS growth improving at 20.23% in the most recent quarter
- Flawless history of surpassing earnings estimates in all four last quarters
- Average earnings surprise of 16.58% above analyst predictions
Revenue growth supports the earnings story:
- Revenue growth of 21.94% over the past year
- Good quarterly revenue growth of 26.25% in the latest quarter
- Steady revenue estimate beats in three of the last four quarters
Profitability measures further support the investment case:
- Current quarter profit margin of 38.59%
- Free cash flow per share of $19.96 with notable 108.61% year-over-year growth
- Analyst positivity shown in 10.46% upward EPS revisions over the past three months
These fundamental traits match Minervini’s focus on companies displaying improving growth in earnings, revenue, and profit margins, elements that often draw institutional interest and lead to continued price gains.
Technical Analysis Summary
The technical report for META gives a good rating of 8 out of 10, showing steady performance across both short and long-term periods. The setup rating of 7 means the stock is currently showing a workable entry pattern with lower volatility and defined support levels.
Key technical observations include:
- Both short-term and long-term trends rated as positive
- Support areas identified between $725.95,$742.04 and $701.41,$705.29
- Resistance seen in the $776.37,$790.01 range
- Recent pocket pivot signal found, hinting at institutional accumulation
- Trading in the higher part of its one-month range between $690.51 and $759.15
The analysis indicates possible entry above $759.16 with stop loss protection below $725.94, representing a measured risk of about 4.38%. For a full technical review, readers can check the full technical analysis report.
Investment Points
For investors looking for more opportunities that fit similar strict standards, the High Growth Momentum + Trend Template screen gives frequently updated results mixing technical strength with fundamental growth traits.
Disclaimer: This analysis is for informational and educational purposes only and does not constitute investment advice. All investment decisions should be based on individual research and risk tolerance. Past performance does not guarantee future results. Please consult with a financial advisor before making any investment decisions.