


Johnson Controls International (NYSE:JCI) Shows Strong Technical Rating and Setup Quality for Potential Breakout
Investors using technical analysis often look for stocks showing both good basic momentum and positive entry chances. One method becoming more popular joins ChartMill’s own Technical Rating and Setup Quality scores to find possible breakout candidates. The Technical Rating looks at a stock’s general technical condition across different time periods, while the Setup Quality score examines consolidation patterns that could come before notable price changes. Stocks with high scores in both measures often offer good risk-reward profiles for traders focused on technicals.
Technical Strength Assessment
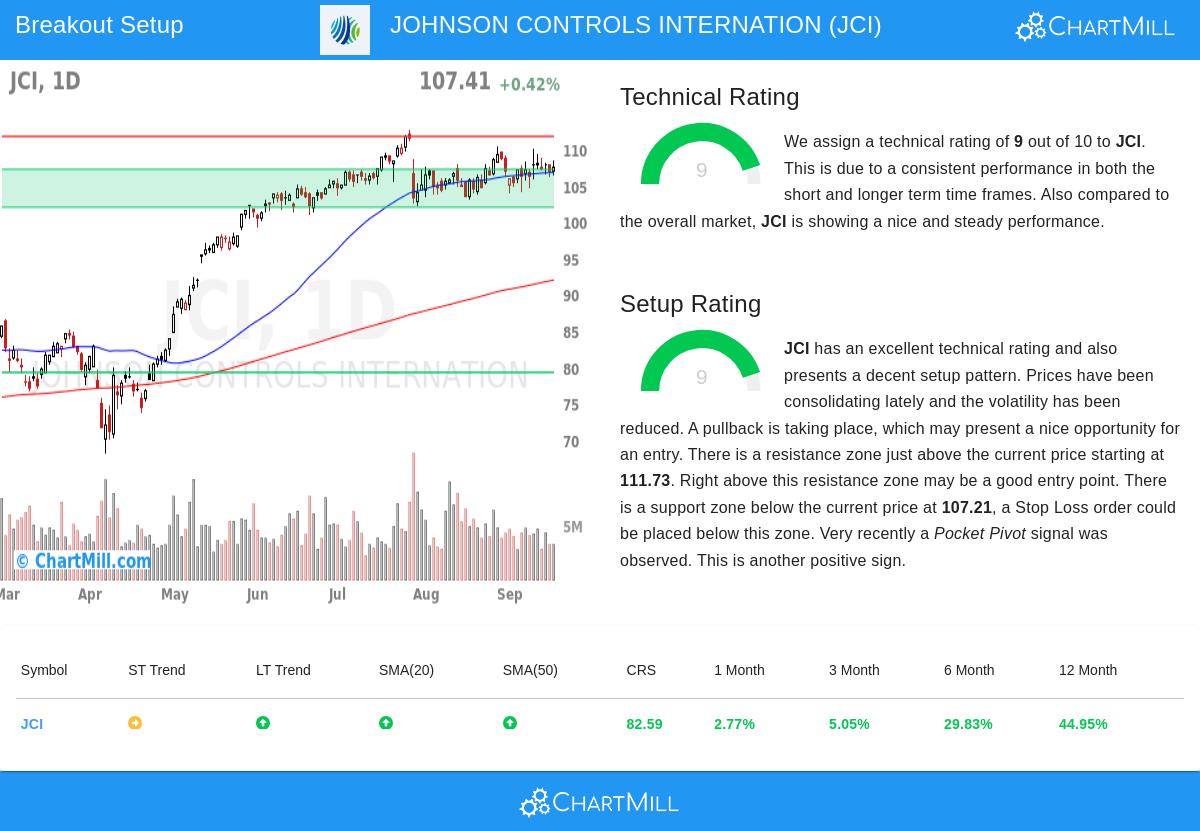
Johnson Controls International (NYSE:JCI) shows very good technical features based on ChartMill’s evaluation system. The company gets a Technical Rating of 9 out of 10, putting it with the market’s best performers from a technical view. This high rating comes from a number of good points:
- The long-term trend is clearly positive while short-term price action shows neutral features
- Very good relative strength doing better than 82% of all stocks and 87% of building products industry peers
- Steady trading above all main moving averages (20-day: $107.06, 50-day: $106.77, 200-day: $91.96)
- Twelve-month gain of 44.95% with increases well-spread across the time
These technical features are important because stocks with high Technical Ratings usually show continued upward momentum and often do better during good market periods. The present situation, with the S&P500 showing positive trends in both short and long-term views, gives extra support for technically good names like Johnson Controls.
Setup Quality Evaluation
Along with its technical strength, Johnson Controls shows a good setup pattern with a Setup Quality score of 9. The stock has been moving within a set area between $103.66 and $110.34 over the last month, showing lower volatility while keeping its place in the higher part of its 52-week range. Several points add to this high setup rating:
- Clear support area found between $101.97 and $107.21 made by several trendlines and moving averages
- Resistance level set at $111.73, giving a clear breakout point
- Recent pocket pivot signal showing institutional buying
- Average daily volume of 4.75 million shares giving enough liquidity
The setup quality is key because it finds consolidation periods that often come before big price moves. Tight trading areas with clear support and resistance levels let traders set exact entry points and stop-loss levels, helping risk management while getting ready for possible breakouts.
Trading Considerations
The technical analysis report points to a possible trading setup with an entry point at $111.74, just above the noted resistance area. This breakout level would show new momentum past the recent consolidation range. The suggested stop-loss at $104.02, under the closest support, means a 6.91% risk per trade. For portfolio managers risking 1% of capital per trade, this means a 14.47% position size.
Traders should know that while the technical setup looks positive, basic factors including coming earnings reports or industry news should be watched. The building products sector stays sensitive to economic cycles and construction activity, which could affect Johnson Controls’ performance no matter the technical patterns.
Continued Screening Opportunities
For investors looking for more technical breakout chances, ChartMill’s Technical Breakout Screener regularly finds stocks showing both good technical ratings and high-quality setup patterns. This tool lets traders quickly search the market for similar chances across different sectors and market sizes.
Disclaimer: This analysis is based on technical indicators and historical performance patterns. It is not intended as investment advice, nor does it constitute a recommendation to buy or sell any security. Investors should conduct their own research and consider their risk tolerance before making investment decisions. Past performance does not guarantee future results.