Watch These D-Wave Quantum Price Levels as Stock Soars to Record High
-
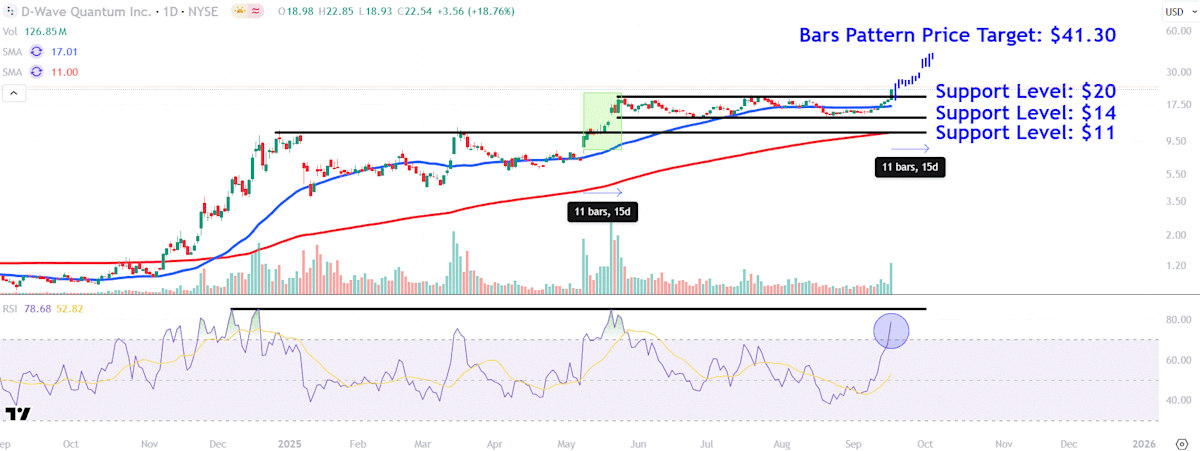
D-Wave Quantum remain in focus after surging 19% to a fresh record high yesterday following the company’s inaugural Qubits Japan 2025 quantum computing user conference.
-
The price broke out from a multi-month trading range on Wednesday, laying the groundwork for a bullish continuation of the stock’s longer-term uptrend.
-
Bars pattern analysis forecasts a potential upside target of around $41.30 and indicates a trend higher could last until early next month. Investors should also watch critical support levels on D-Wave’s chart around $20, $14 and $11.
D-Wave Quantum (QBTS) shares remain in focus after surging to a fresh record high yesterday following the company’s inaugural Qubits Japan 2025 quantum computing user conference.
The event provided an opportunity for D-Wave to showcase its technology to customers in the Asia Pacific, a region where it posted a 83% jump in bookings amid increasing development of quantum AI applications.
D-Wave shares were up 1% at $22.75 in recent trading early Thursday, after gaining 19% yesterday. The stock has risen about 170% since the start of 2025 and more than 2,000% over the past year. Investor sentiment has been boosted by the unveiling of the company’s newest quantum computer, known as Advantage2, along with broader optimism about potential applications of the nascent technology across multiple industries.
Below, we take a closer look at the technicals on D-Wave’s chart and identify critical price levels worth watching out for after yesterday’s jump.
D-Wave shares broke out from a multi-month trading range on Wednesday, laying the groundwork for a bullish continuation of the stock’s longer-term uptrend. It’s worth pointing out that the shares registered their highest volume since late May, indicating larger investors participated in yesterday’s buying.
While the breakout coincided with the relative strength index crossing into overbought territory, the indicator remains below its previous peaks, providing further room for the shares to test higher prices.
Let’s apply technical analysis to forecast how a continuation move higher may play out on D-Wave’s chart and also identify critical support levels worth eyeing during possible retracements.
Investors can use bars pattern analysis to project where D-Wave shares may be headed next. When applying the analysis to the stock’s chart, we extract the stock move higher in May and overlay it from the low of Wednesday’s breakout bar. This forecasts a target of around $41.30, implying 83% upside from yesterday’s closing price.


Leave a Comment
Your email address will not be published. Required fields are marked *