

Negative Earnings: Another Speculative Favorite
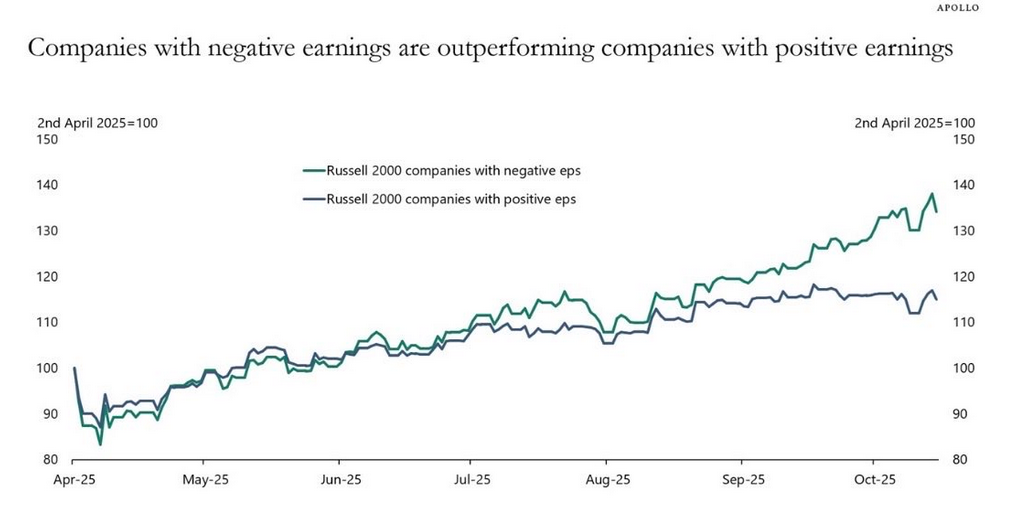
The chart below, courtesy of Apollo’s Torsten Slok, shows that small-cap companies with negative earnings have outperformed small-cap companies with positive earnings by about 30% since early April. Per Torsten:
“Something remarkable is going on in the equity market. Stock prices of companies with negative earnings have in recent months outperformed stock prices of companies with positive earnings.”
This performance divergence, in which companies with negative earnings outperform those with positive earnings, is just a part of a broader trend in which investors are increasingly willing to take on more speculative assets and rely less on stocks with more sound fundamentals as they reach for extra returns. A better way to define the trend: investors are betting on estimates of future earnings growth rather than on the stability of actual earnings.
Another instance is the ARKK fund run by Cathy Wood. Of the 46 equity positions, six have positive earnings over the last twelve months. However, comparing small-cap stocks to ARKK is not entirely fair, as her fund invests in early-stage innovators, where expected growth is often prioritized over current profits.
This positive-versus-negative earnings divergence reminds us of a phrase worth considering: Is a bird in hand worth two in the bush? The market says no, what do you say?
What To Watch Today
Earnings
(Click on image to enlarge)

Economy
(Click on image to enlarge)

Market Trading Update
In case you missed it, we touched on the divergence of energy stocks from oil prices on Friday. The S&P 500 closed Friday at a record 6,753, confirming a breakout above the previous resistance and setting all-time highs. That breakout vindicated the bulls after a successful test of the 50-DMA support level previously. Furthermore, the market reclaimed the rising bullish trend line from the “Liberation Day” lows and triggered a momentum (MACD) “buy signal, confirming that the bullish bias remains intact. Moving averages also continue to trend higher, reinforcing the overall bullish setup.
(Click on image to enlarge)

Notably, breakouts to new highs typically attract momentum buyers to chase prices higher, and the move continues to cement the “buy the dip” philosophy as a “risk-free” process. Unsurprisingly, retail investors flooded back into familiar trades, Nvidia, Meta, Apple, and AMD, meme stocks, more shorted and non-profitable stocks, and large buyback stocks. That speculative buying frenzy remains propelled by monetary accommodation hopes, AI enthusiasm, and algorithmic confirmation.
Technically, there are reasons for some short-term caution. Money flows show a “negative divergence,” which suggests the move is not as strong as it appears. Furthermore, the internal structure of the market remains a concern. Breadth remains weak, with fewer stocks participating in the rally, and most of the upside is concentrated in a narrow group of mega-cap leaders. This divergence between index performance and market internals creates a fragile foundation. Momentum indicators, such as the Relative Strength Index (RSI), are back near overbought territory but remain in a negative divergence, as shown above. Recent gains have come on declining volume, suggesting waning conviction.
With that said, as we move into November and December, the seasonal bias of the market is higher, and investors should remain committed to equity exposure. However, that does NOT mean the market won’t experience some bumps and bruises. As such, traders and investors should be cautious at these levels. While the breakout is technically significant, confirmation requires broader participation and follow-through. Without that, this rally becomes increasingly vulnerable to sharp reversals. For those with existing exposure, now is the time to tighten stop-losses, trim extended positions, and prepare contingency plans.
Support and Resistance Levels:
- Resistance: ~6,8500-6,900 (top of rising trend channel shown above)
- First Support: ~6,700 to (20-day short-term moving averages)
- Second Support: ~6,600 to (50-day short-term moving averages)
- Crucial Support: ~6,100-6,200 (significant structural support of breakout of February highs and the 200-day moving average.)
In this environment, investors should manage exposure with discipline. Participate in the trend if it extends, but recognize that there are risks as strength remains concentrated and fragile. The next phase will depend on whether breadth and earnings can confirm what price action is now signaling.
CPI & The Week Ahead
On Friday, the BLS published its “rare exception” CPI inflation report despite the government shutdown. Inflation was 0.1% weaker than expected, with CPI rising 0.2% in August and Core CPI rising 0.3%. The data had little impact on the bond market, likely because it was stale and did little to change expectations for the Fed’s actions this week at its FOMC meeting. A driving force of inflation continues to be the declining inflation rate of shelter prices, as shown below. Given that CPI shelter data lags significantly and accounts for 40% of CPI, we can expect shelter prices to continue to dampen CPI for many months to come.
With the government shutdown continuing, economic data will be light. We suspect that the employment report will come out over the next week or two, regardless of whether the shutdown ends. The Fed meets on Wednesday with market expectations nearing 100% that they will cut rates by 25bps. Given Powell’s recent comments on QT and signs that liquidity is becoming scarcer, we expect the Fed to announce a plan to end QT by year’s end. It is possible they could stop it at this meeting.
Earnings will again be prominent this week with the large technology companies reporting. Of note will be the following:
- Tuesday: Visa and United Health
- Wednesday: Microsoft, Meta, Google, and Caterpillar
- Thursday: Apple, Amazon, Eli Lilly, and Mastercard
- Friday: Exxon, AbbVie, and Chevron
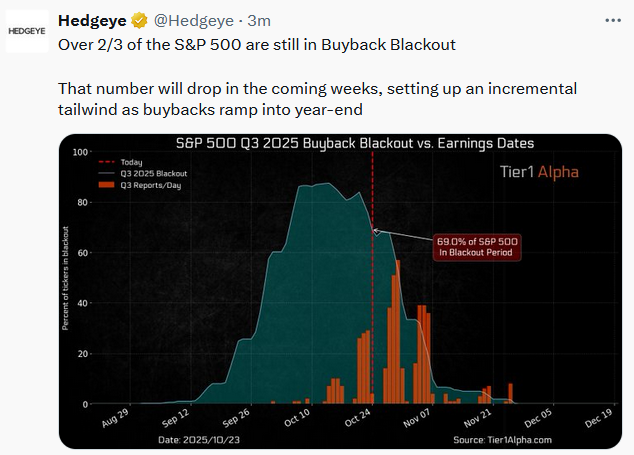
The Tweet of the Day at the bottom shows that next week will feature the most earnings announcements of the cycle. Further, it highlights that the percentage of companies in share buyback blackouts will decline rapidly over the next few weeks.

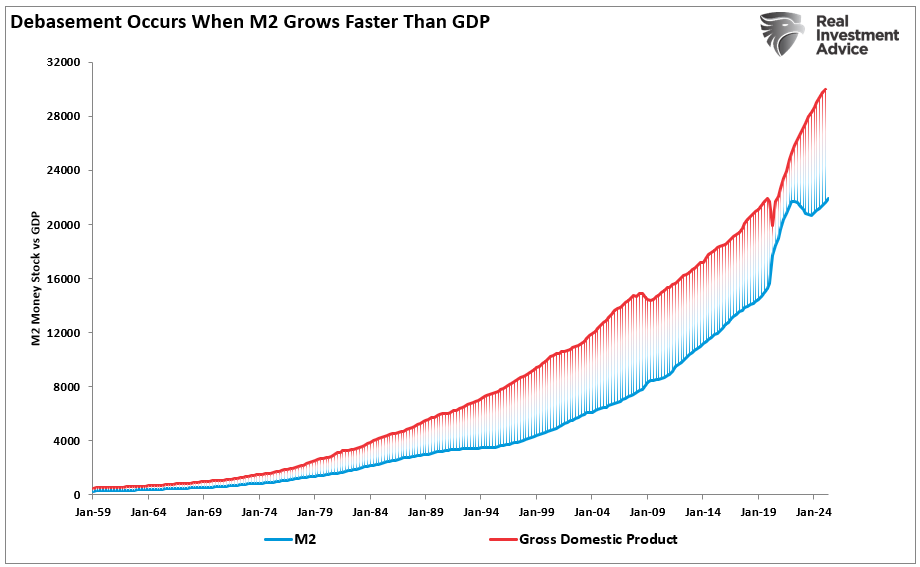
Money Supply Growth: A Thesis With A Fatal Flaw
Recently, MarketWatch ran a provocative headline: “When the world’s largest asset manager and the Bond King both agree: Run to gold, silver, and bitcoin.” The article highlighted how Larry Fink’s BlackRock and Jeffrey Gundlach, often dubbed the “Bond King,” see deficits and “money printing” as reasons for investors to escape fiat currencies and pile into hard assets. As Gundlach put it:
“Deficits are out of control, the government is printing too much money, and the dollar is destined to decline.”
With a similar refrain, Larry Fink noted that “hard assets are one of the few places left to preserve wealth.”
At first glance, it sounds persuasive. After all, the U.S. is running record deficits, high debt levels, and the Federal Reserve recently cut interest rates, adding to fears of renewed money supply growth. However, a closer look at the fundamentals of modern money creation and the role of government deficits reveals that this thesis is too simplistic. Basic economics suggests a different conclusion: money supply growth is primarily a reflection of economic growth, government deficits actually contribute to private-sector savings, and gold’s price remains tethered to the dollar and real interest rates, which means a dollar rally could easily derail the “hard asset” trade.
In other words, while the thesis makes for a bold headline, it misses the underlying mechanics driving prosperity and asset prices.
Let’s dig into this topic further and start with money supply growth.
Tweet of the Day
More By This Author:
The Most Dangerous Era In History
Retail Leverage Goes To Extremes
Money Supply Growth: A Thesis With A Fatal Flaw